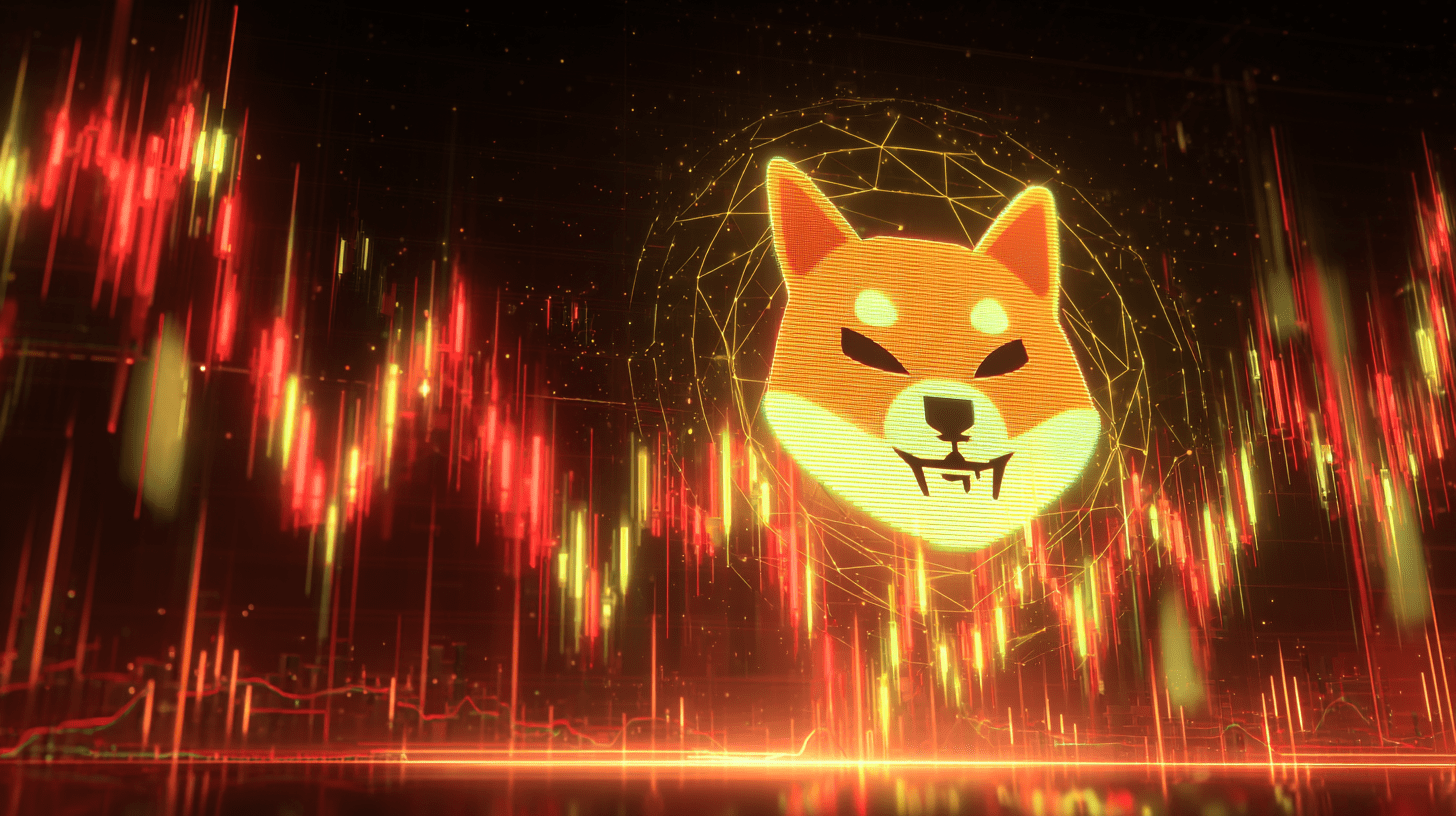

A new Shiba Inu price prediction from technical market analysts suggests the token could be preparing for a significant rally, with one forecast targeting a potential 200% move to the $0.000032 resistance level. This bullish outlook is based on interpretations of SHIB’s recent price action, which chartists believe indicates the end of a prolonged consolidation period and a breakout from a key accumulation pattern.
- Financial analysts issue a unified market forecast predicting a massive price expansion for the Shiba Inu digital asset.
- Technical projections target a 200 percent upward surge based on rising transaction volumes across the Shibarium network.
- This bullish outlook creates fierce market tension as retail investors attempt to front-run anticipated Wall Street capital inflows.
Technical Basis for the Shiba Inu Price Prediction
The primary catalyst for this optimistic Shiba Inu price prediction comes from technical analyst JavonTM1. In a post on the social media platform X, the analyst presented a long-term price chart indicating SHIB has already broken out of a key accumulation structure. The chart specifically highlights a “Symmetrization Break” that occurred earlier in the year as a pivotal technical event.
According to him, this development is a precursor to a potential major price move. “$SHIB (Shiba Inu) looks to be already broken out of a key accumulation,” he wrote.
He added that prices “can be preparing here for a ~200% move to test a resistance in the $0.000032s again.” The analysis also noted the presence of “bull divergences” earlier in the year, which are technical indicators often used to signal a potential trend reversal to the upside.
Genuine News Deserves Honest Attention.
High-conviction projects require an intelligent audience. Connect with readers who value sharp reporting.
👉 Submit Your PRAccumulation Patterns Bolster Bullish Shib Price Prediction
This sentiment is supported by other market observers focusing on shorter timeframes. The trader known as army_shiba shared a near-term SHIB chart on X, identifying a complementary bullish pattern.
The chart shows SHIB’s price consolidating within a descending channel, a formation traders often call a “bull flag,” which typically resolves in an upward breakout. “I pretty much love $SHIB price action,” army_shiba commented.
“It is slowly accumulating & forming a bullish pattern. Once it breaks out of this low range, it will go much higher.” The chart included a projection of a sharp upward move from its trading level near $0.00000994.
Both analyses rely on the thesis that a period of quiet accumulation is ending, and the next phase could be a significant price expansion if buying volume increases.
Chain Street’s Take
Shiba Inu may be waking from its long slumber. Technical analysts see signs of life in SHIB’s chart, a clean breakout from months of accumulation and early bull divergences hinting at renewed momentum. Whether it’s a head fake or the start of a larger cycle, the $0.000032 level could soon tell the story.
Activate Intelligence Layer
Institutional-grade structural analysis for this article.